Our Monitoring Officer, Katrin, has travelled to St Andrew’s in Scotland to brush up on statistical analysis skills. Here she answers the question “So do you prefer going out on a boat to analysing the data?” – a genuine question she’s been asked on her travels…
There’s only one correct answer to that question and it’s not what you think it is as I’m currently spending a lot of time with CREEM, the Centre for Research into Ecological and Environmental Modelling at the University of St. Andrews which is part of the School of Mathematics and Statistics. As many people that I know in the field of marine mammal science, I do actually prefer being out on the boat collecting data- and that can be a problem. The whole point of collecting data is, after all, to analyse it in order to advise on conservation status of the species you are working with and for that, a rigorous statistical analysis is important and having an insight into the underlying statistical analysis will usually improve your design. For this reason, I am spending three weeks at St. Andrews with CREEM and SMRU, the Sea Mammal Research Unit, to brush up on my analysis skills to optimise the running of the Cardigan Bay Monitoring Project at home in Wales.
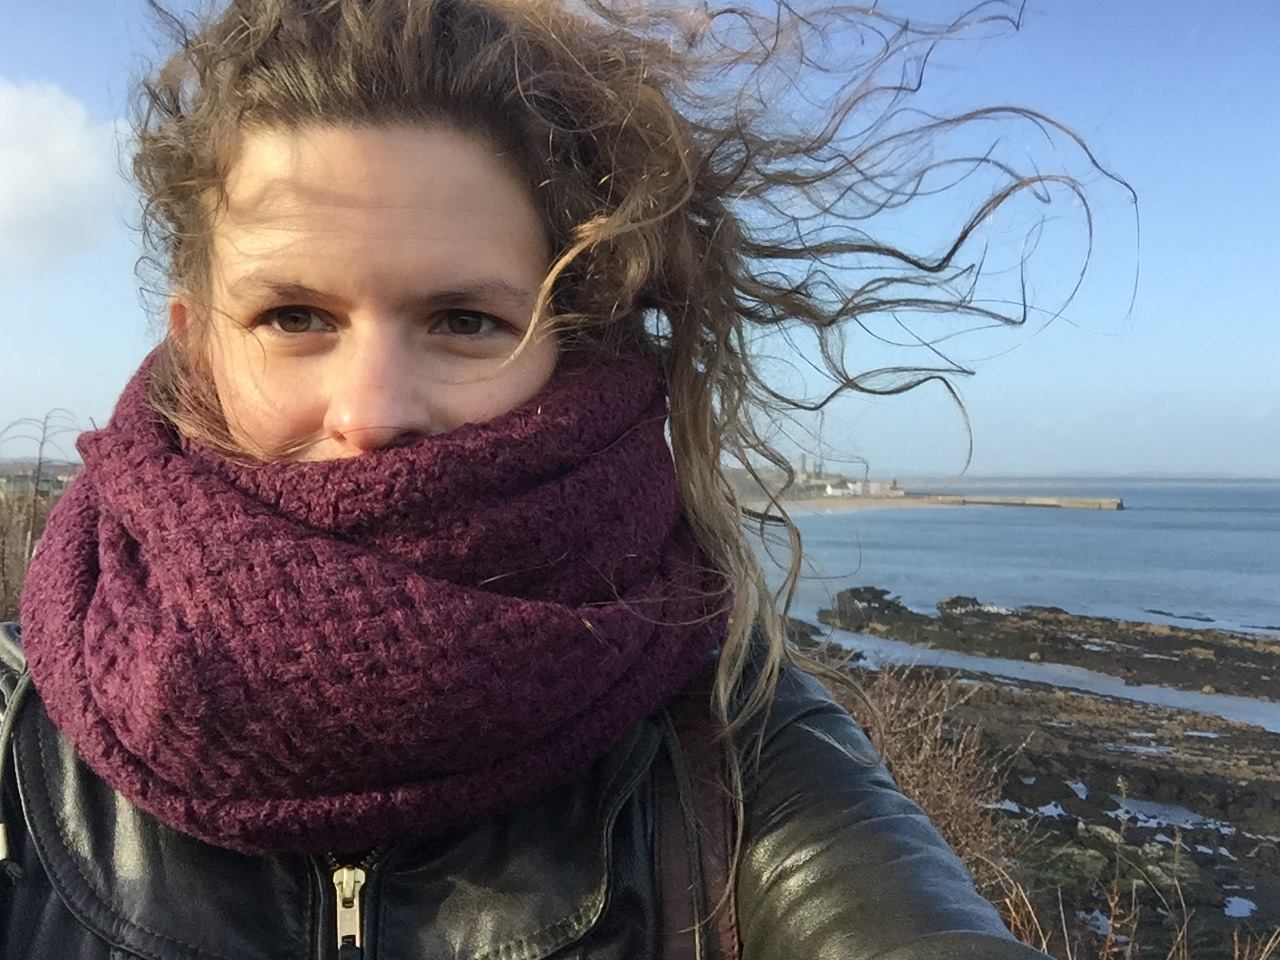
Katrin exploring St Andrew’s in between stats sessions.
One of the key questions that decision makers are interested in, are population estimates and trends, how many animals are there and how are they doing? There are a number of ways you can estimate populations; we use two methodologies, Distance Sampling and Capture-Mark-Recapture (CMR) analysis. Both give abundance estimates but measure slightly different things; CMR estimates the number of different individuals within the study area over a particular period whereas Distance Sampling provides an estimate of the average number of animals within the study area.
During our summer surveys, we collect data for both CMR and Distance Sampling analysis. Most of our data is collected during dedicated line transect surveys; full day surveys where we follow set routes and record environmental data along the way. When we encounter dolphins, we record the GPS position, the angle and the distance from us as well as group size. This is information we use during our distance analysis to arrive at yearly abundance estimates. By estimating how many animals we see on given tracks, we can calculate on average how many animals are in our study area. In addition to this, whenever we encounter dolphins, we break away from our track line and take pictures for photo-identification which will be used in the CMR analysis. During photo-identification, we photograph the dorsal fins of dolphins and attempt to identify individuals by the unique markings (nicks, notches and scratches) on their dorsal fins. During conventional CMR analysis, animals are often actually captured, marked with an identifiable feature, released, and then hopefully recaptured at a later date, a classic example of these would be bird ringing. Since we can already identify dolphins by their individual markings, this is not necessary in our case and ‘capture’ refers to the animal being ‘captured’ in a photograph rather than a net. CMR also has the advantage that we can use some data from opportunistic platforms such as tourist vessels which we cannot include in our distance analysis, so most of the pictures that we take from aboard our recommended boat operators feeds into this analysis. CMR also allows us to calculate survival rate, ie. what percentage of the population survives from year to year as well as looking at emigration of known individuals from the study area. Survival rates in particular are quite important as it gives us an indication whether the population is sustaining itself or is likely to suffer a decline.
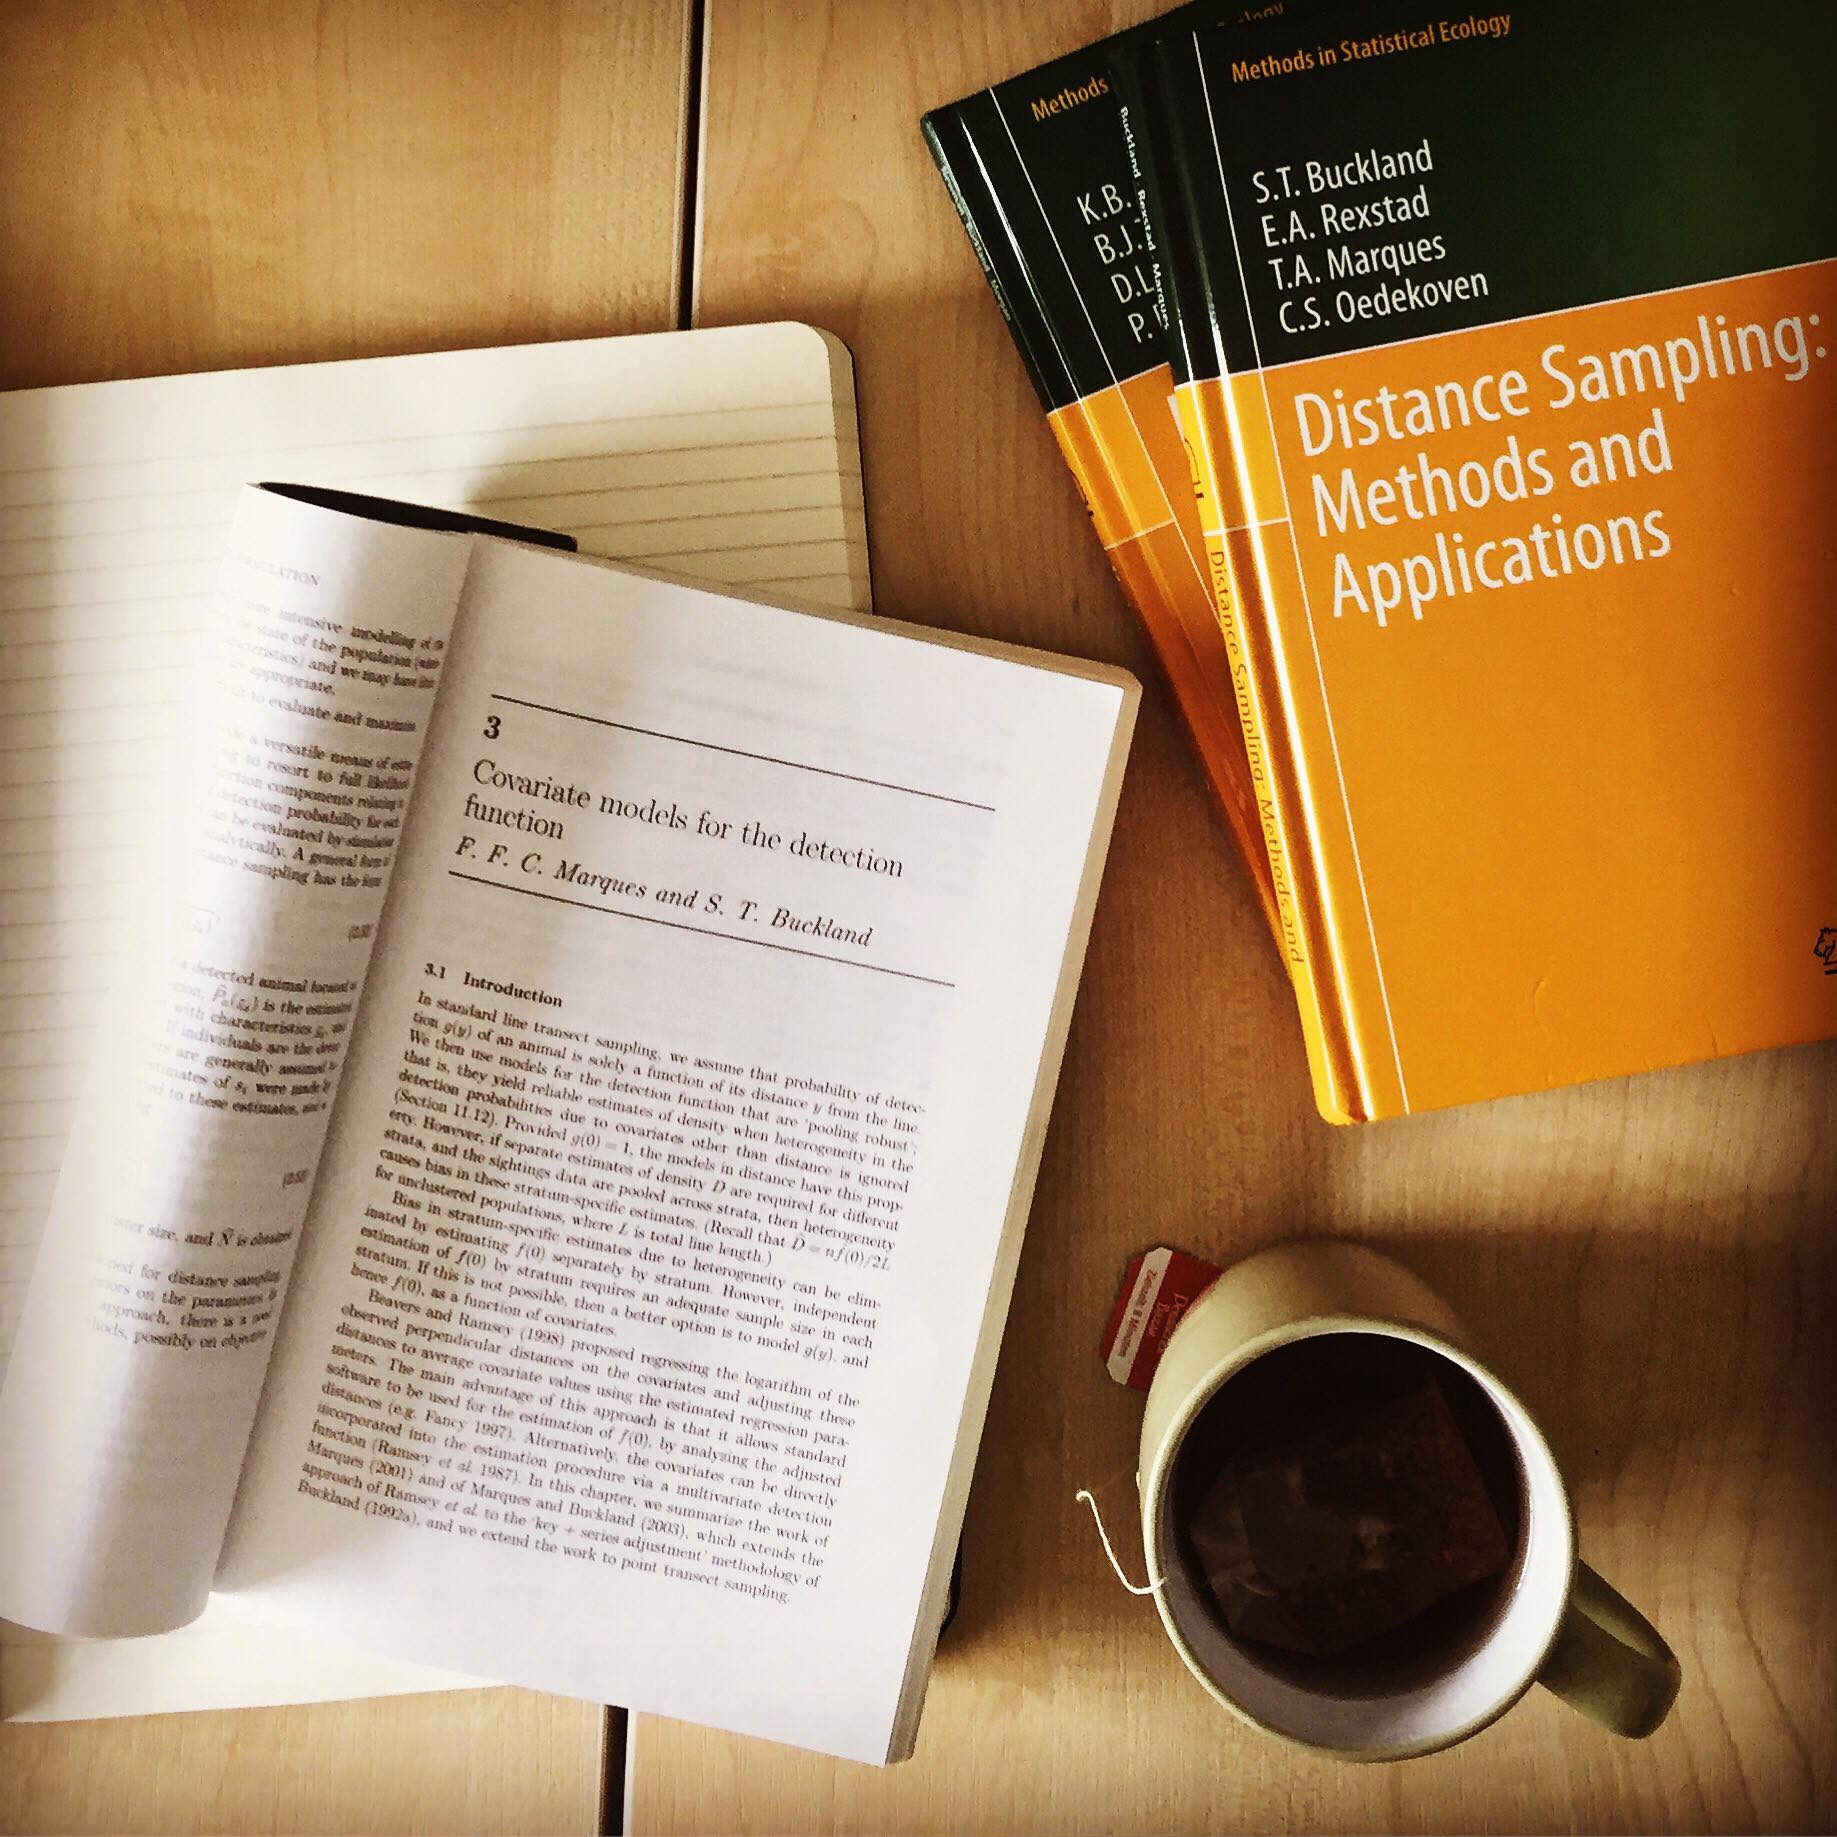
Katrin is a tea-fuelled being. If you like pics like this you can follow her on Instagram.
Modelling population is a tricky business and there are many factors that need to be considered when choosing the best model, there’s nearly always room for improvement and in that spirit, we’re very thankful for CREEM and SMRU for hosting me for a lovely three weeks of stats to help me learn (to attempt to) love analysis as much as the field work (here’s hoping!). Particular thanks to Phil Hammond and his lovely PhD students from SMRU and Len Thomas and Rick Camp from CREEM who opened up their offices for me and made sure there was always tea and/or cake to help with the learning process!

